Project Cost & Schedule Performance Dashboard

Portfolio Sample

Custom industrial equipment doesn't get built off a shelf, every order runs as its own project, with its own budget, schedule, and cost categories. This dashboard answers two questions across two years and 56 projects: are we spending what we planned, and are we hitting our dates?

Sample ProjectFor Demonstration Purposes

Disclaimer: The data used in this project was AI-generated based on prompts I created, built to reflect realistic industry patterns rather than a dramatic or invented story, intended to showcase example dashboard design and analysis.

The Business Question

Manufacturers that build custom, project-based equipment don't have a single answer to 'are we on budget', every order runs as its own project, with its own budget, schedule, and mix of cost categories. Leadership needed one consolidated view across the full portfolio to answer two ongoing questions: are we spending in line with what we budgeted, and are we hitting our schedules, and if not, where specifically is it breaking down?

The Data Source

A synthetic six-table relational dataset modeled after a mid-size industrial equipment manufacturer, covering 56 projects and roughly 2,500 monthly budget and actual-spend records across two years. The data was built with deliberate real-world realism, calibrated variance ranges, a genuine cost-pressure trend, and natural partial-period project timing, rather than a single dramatic anomaly planted to make the analysis look interesting.


My Approach

I modeled the six-table relational structure in Power Query, then built DAX measures for budget variance and schedule adherence that could roll up cleanly from individual projects to a full portfolio view. 

The two-page structure was intentional: Page 1 gives leadership the headline numbers at a glance, and Page 2 lets them drill into exactly which division or cost category is driving the trend, so the same dashboard works whether someone has thirty seconds or ten minutes.

Visualizations

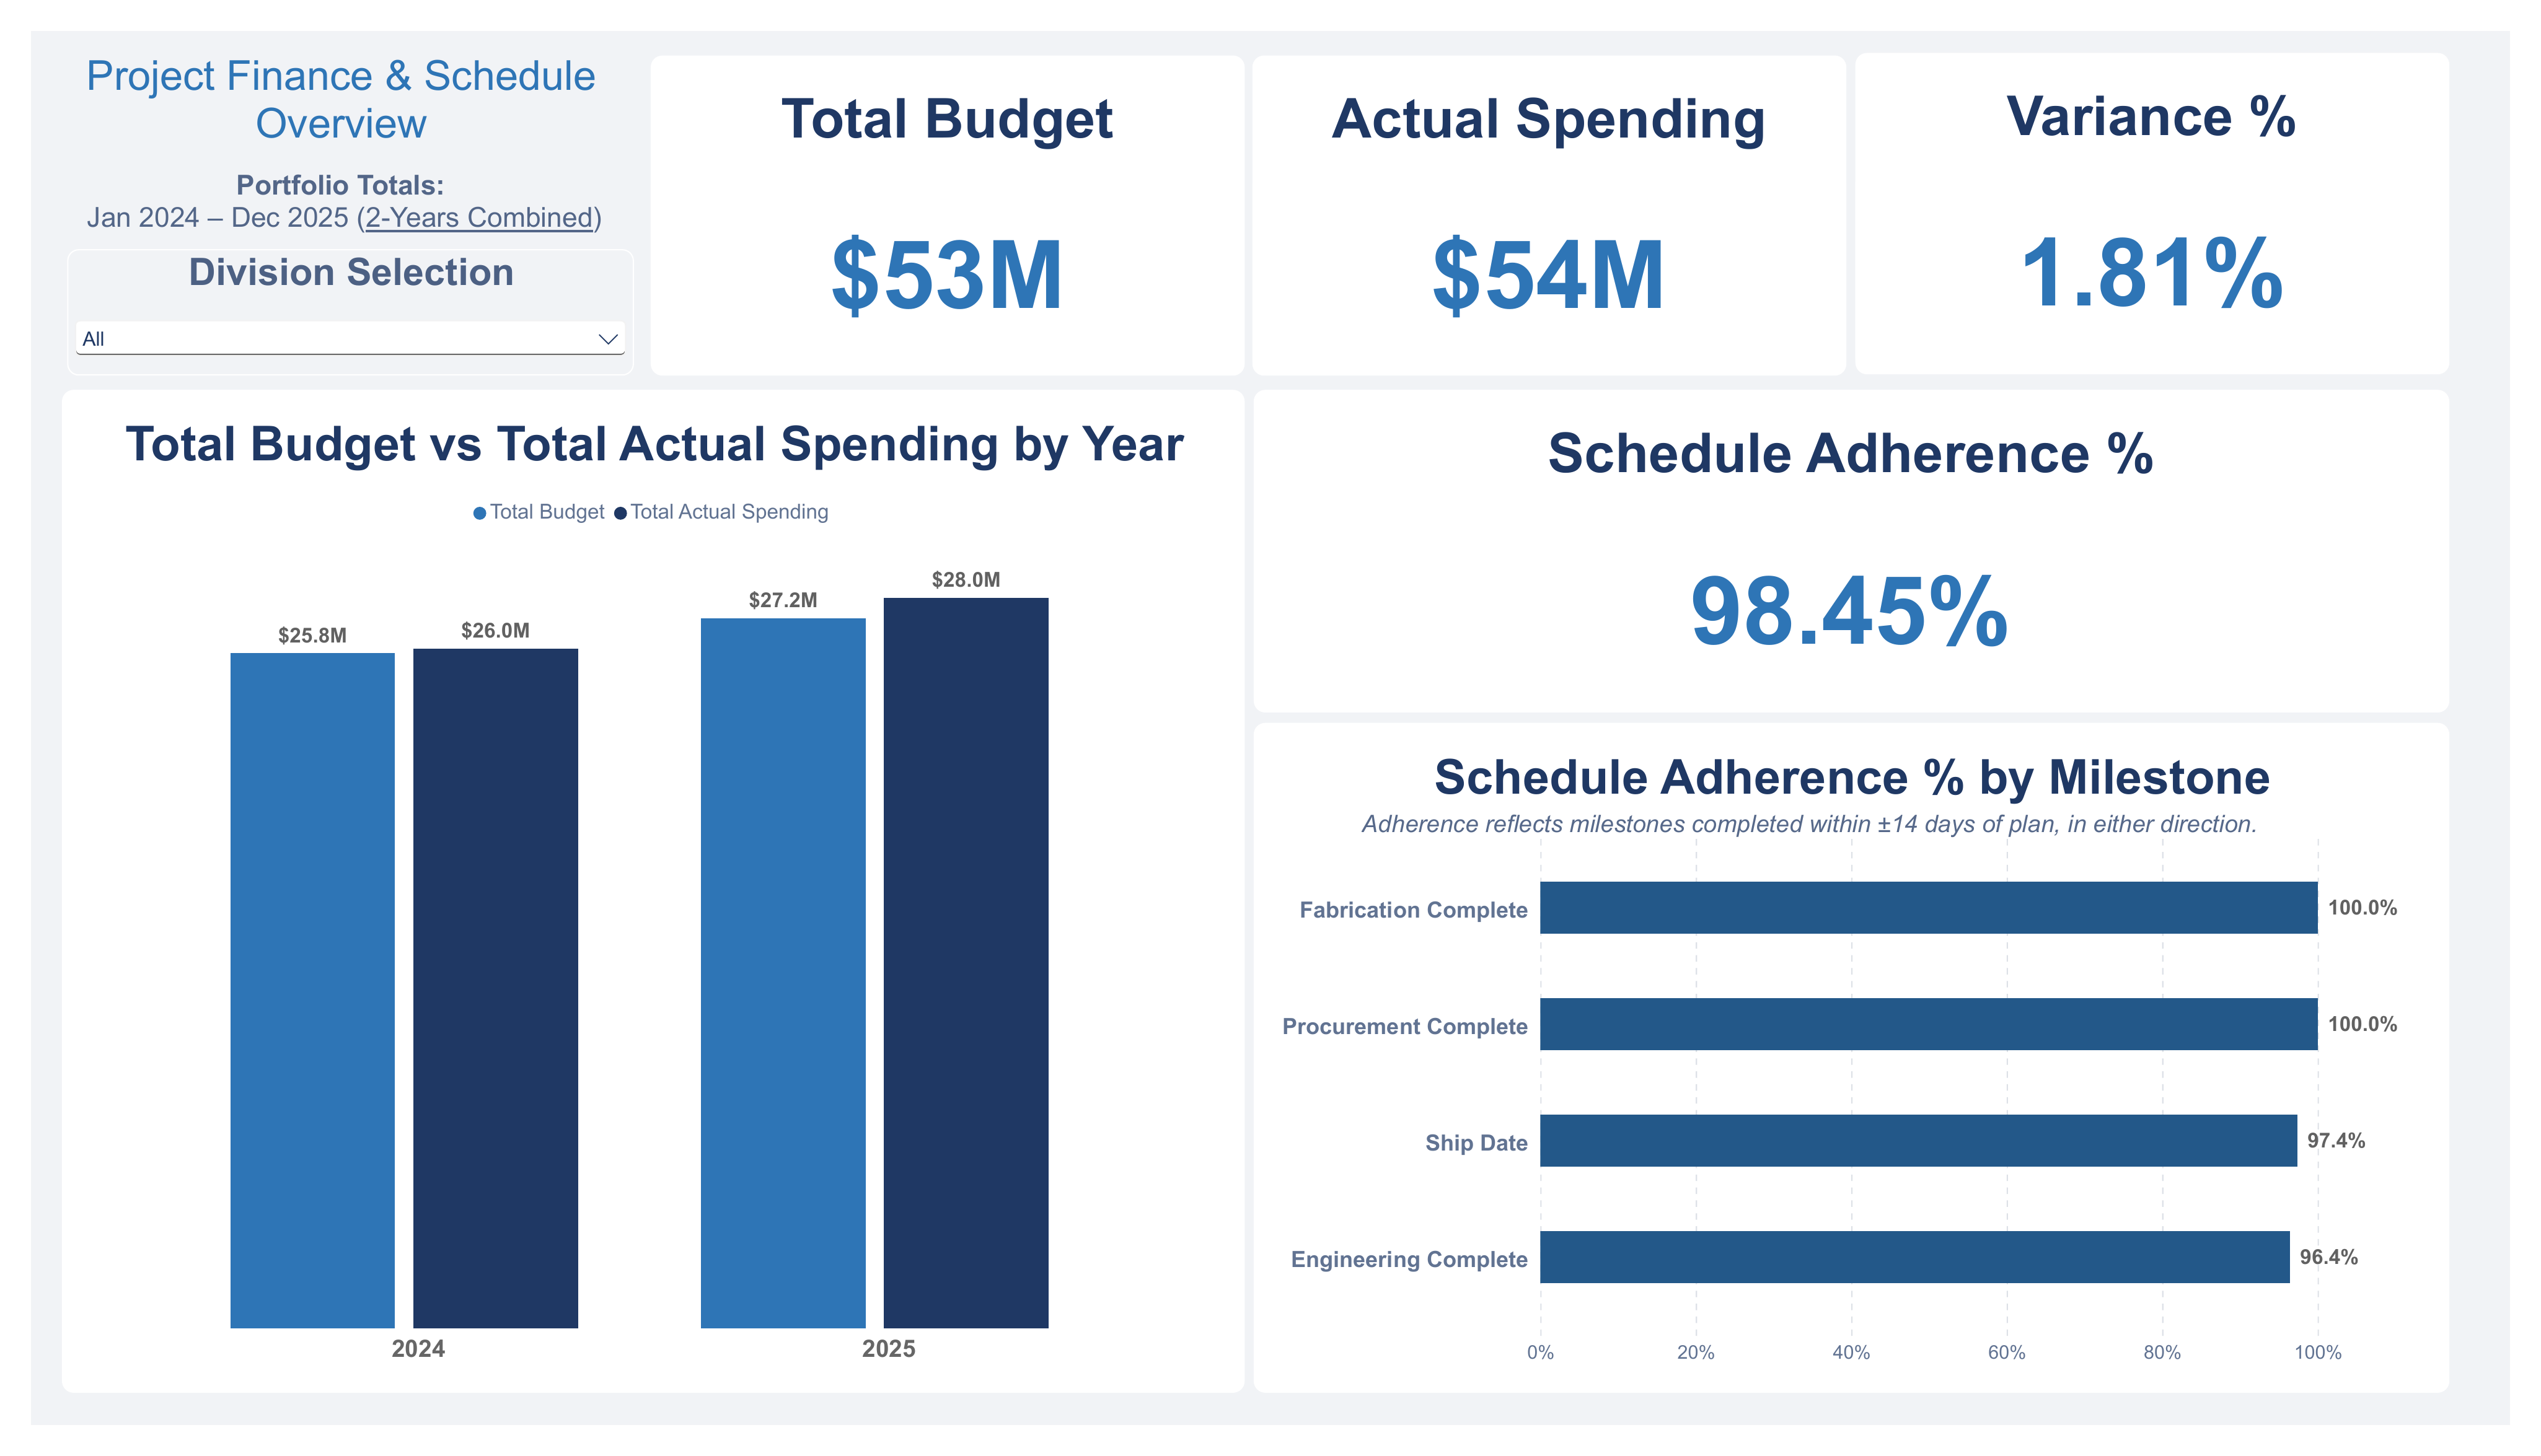
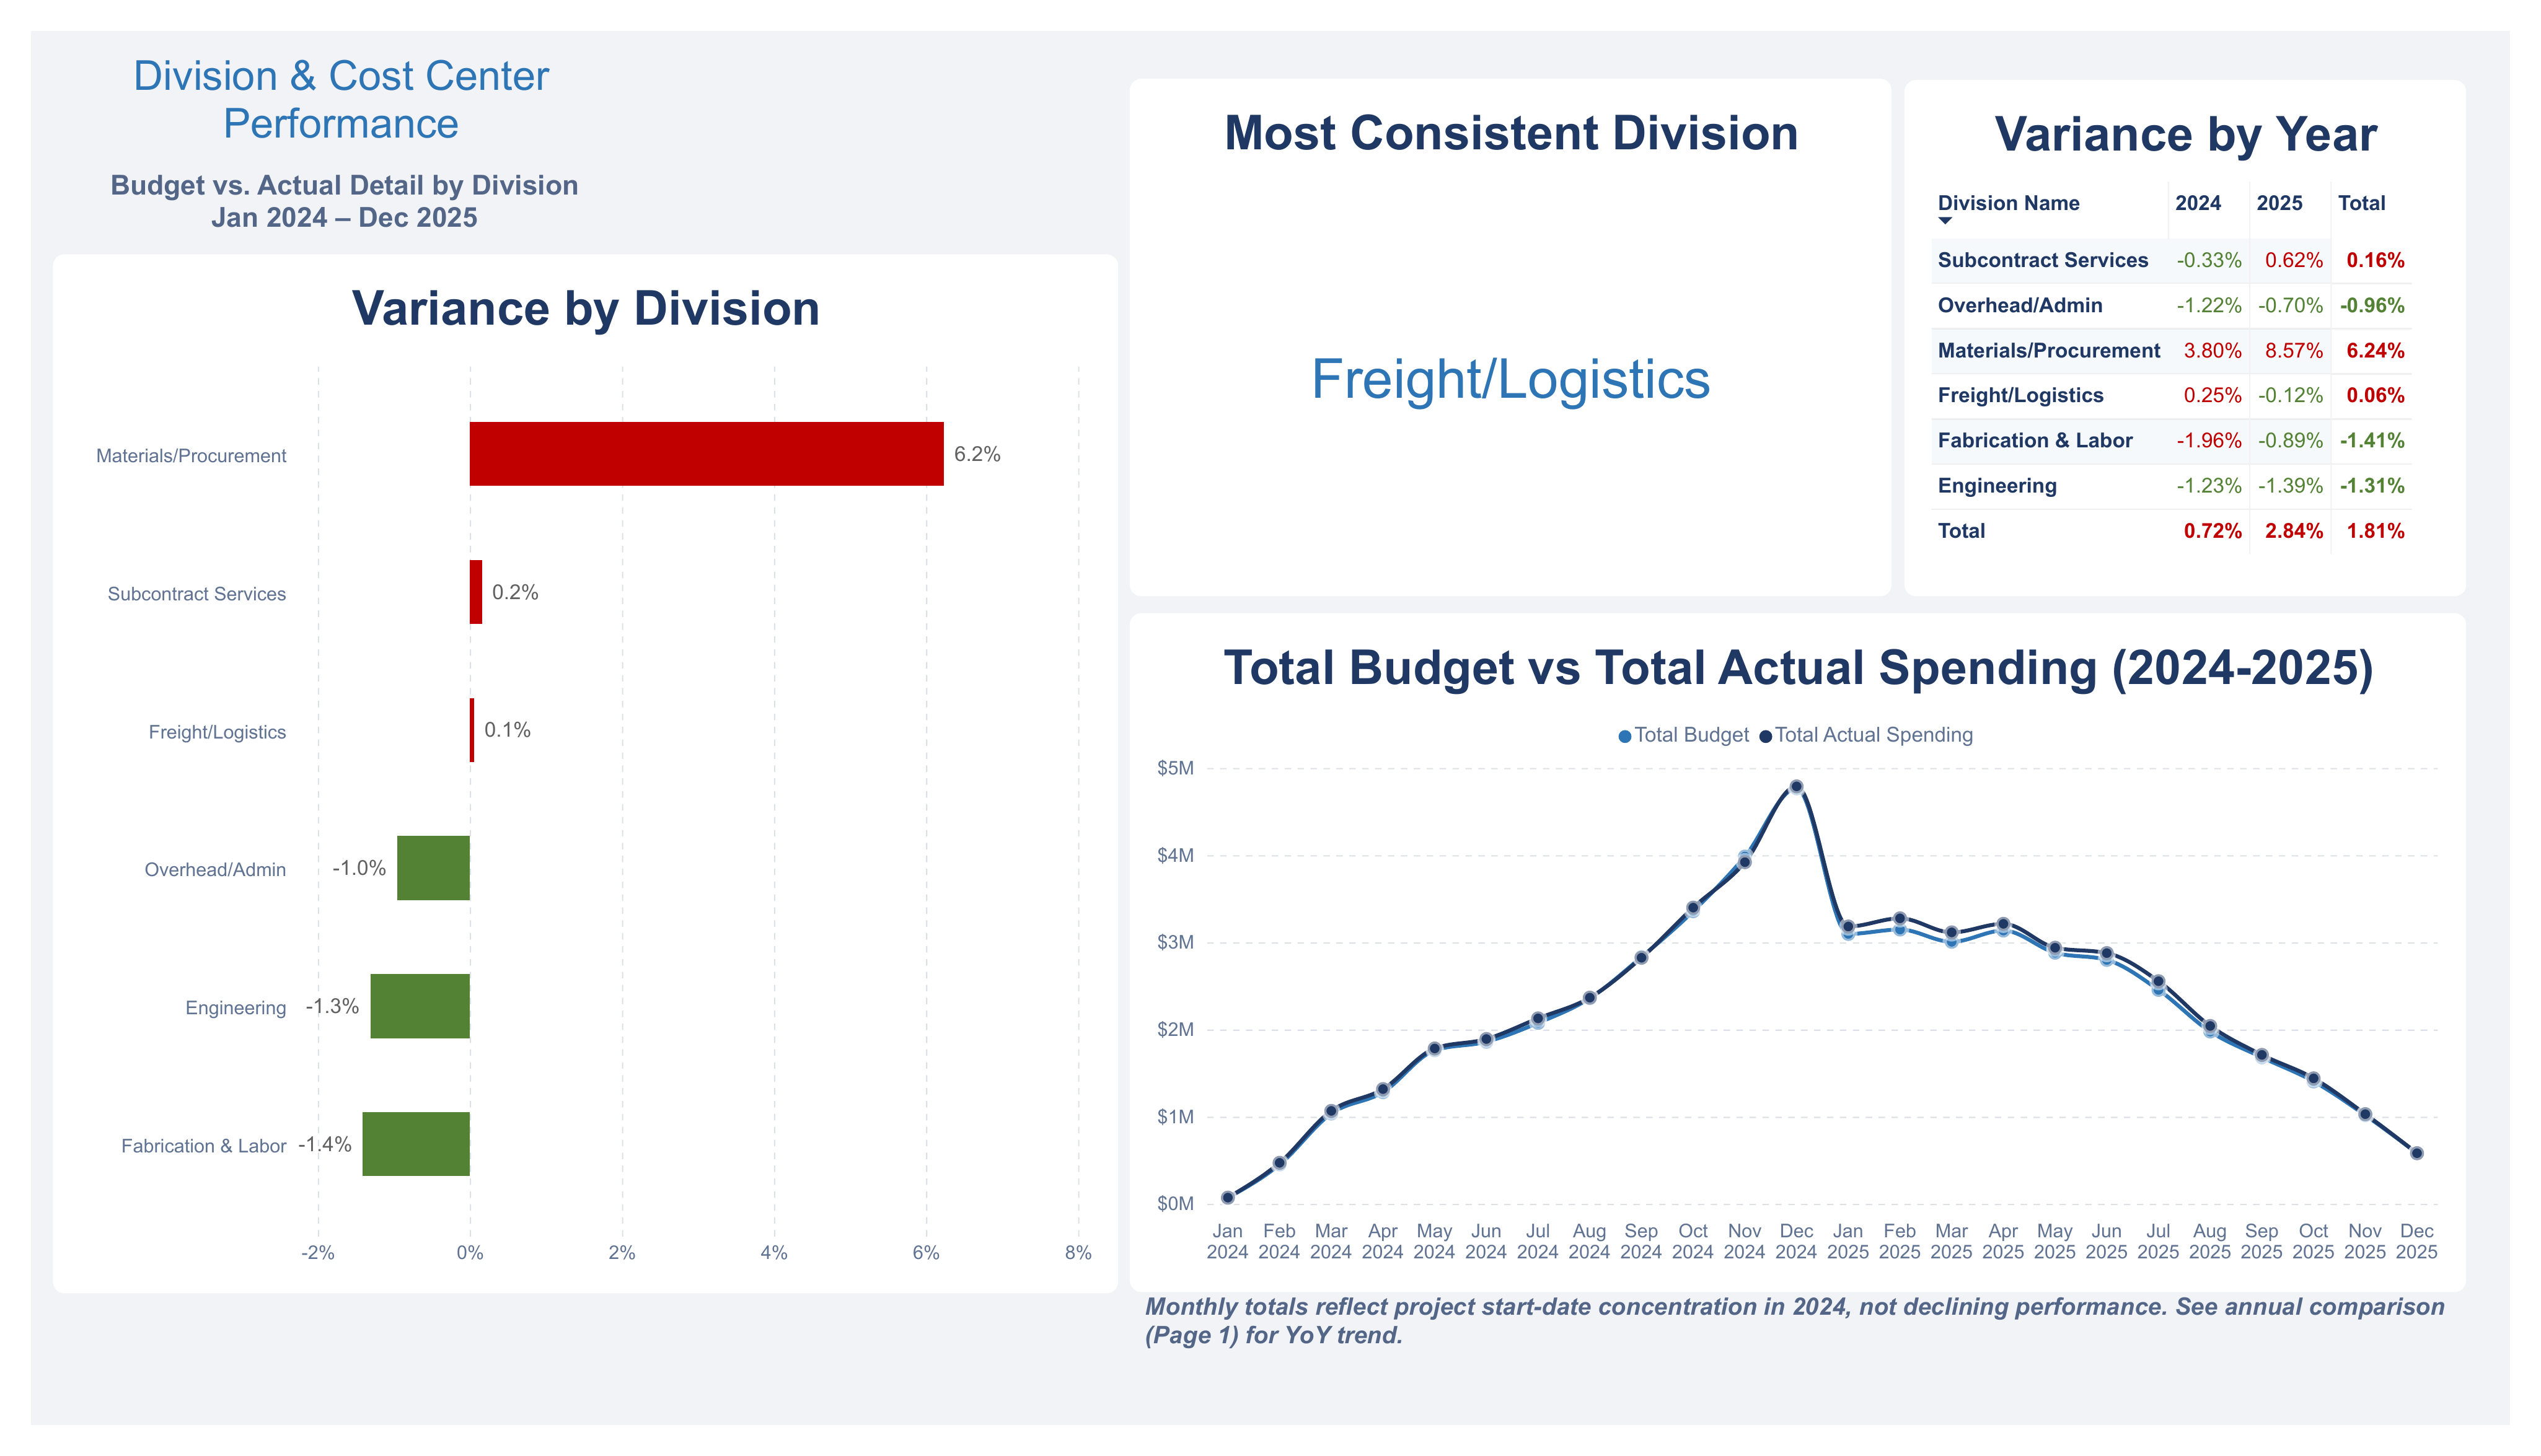
Page 1 shows the full portfolio's budget, spending, and schedule performance across both years. Page 2 drills into which division or cost category is actually driving that performance. Click either screenshot to expand.

Design Note: This dashboard was kept intentionally simple, the focus was the data model and analysis, not the visual design. A production dashboard for an actual business would be tailored and polished well beyond this sample work.

Downloads

Everything behind this dashboard is available to download: the Power BI file, a PDF version, and the full dataset.

Key Findings

Portfolio spending ran about 1.8% over budget across the two-year period, normal, well-controlled variance, not a red flag on its own.

Materials/Procurement is the exception, and the one worth watching: cost overrun there grew from roughly +3.8% in 2024 to +8.6% in 2025, consistent with real-world material and steel cost pressure rather than a one-time miss.

Schedule performance stayed strong throughout, with 96–100% of milestones across all four project phases landing within ±14 days of plan.

Freight/Logistics was the most consistently on-budget division across both years, the clearest example of a cost category performing exactly as planned.

1.81%
Overall Cost Variance
98.45%
Schedule Adherence
+8.6%
Materials/Procurement Variance (2025)